
Automated Chart Intelligence Powered by Vision Models
Upload any chart screenshot across equity, FX, and commodity data. FXCharts extracts geometric patterns, trendlines, and key zones in milliseconds using neural vision inference.
Zero Brokerage Integration
Pure image analysis. Ingests static PNG/JPG screenshots with zero financial trading access.
Universal Chart Compatibility
Pre-trained on TradingView, Bloomberg, MT4/MT5, and mobile exchange interfaces.
Sub-100ms Inference Pipeline
High-throughput GPU inference with instant SVG and JSON coordinate output.
Core Capabilities
Engineered specifically to solve financial visual understanding. We parse raw screenshot pixels into deterministic geometric coordinates without relying on broker feeds or tick data.
Multimodal Vision Ingestion
Processes uncompressed chart screenshots, eliminating noisy indicators and parsing pure visual price action.
Geometric Pattern Extraction
Automated neural models detect channels, wedges, and trendline convergence as pure spatial coordinate data.
Structured Educational Insights
Returns clear contextual breakdowns and technical annotations with zero broker ties or trade execution.
Technical Inference Pipeline
Scalable cloud infrastructure engineered for high-throughput visual recognition. Ingesting uncompressed chart frames and serializing geometric coordinates in under 600ms.
Client Capture
User captures or uploads chart screenshot via iOS client.
Cloud GPU Inference
Vision model normalizes pixel data, runs spatial recognition, and computes level coordinates.
Structured Analytical Output
Delivers interactive SVG vector overlays and educational metadata back to the client in under 600ms.
Test the Computer Vision Engine Live
Select a financial chart preset below or simulate custom image ingestion to witness instant spatial segmentation and structural inference.
Detected Geometric Entities
3 IdentifiedAscending Triangle
Continuation
Confidence
Fair Value Gap (FVG)
Imbalance
Confidence
Bullish Order Block
Demand Zone
Confidence
Predictable Pricing for Chart Vision
Get started with 1 free analysis before the paywall triggers, then choose the Pro plan that fits your trading routine.
Free Trial
1 Free ScanTest our neural vision models on your own chart screenshot. Includes 1 full analysis before the paywall triggers.
Pro Access
Unlimited VisionUnlimited neural chart vision and multi-timeframe pattern detection for serious analysts.
Only ~$3.33 / month (~$0.77/wk) • Billed annually at $40/yr
Unlock Pro AccessIn-App Purchases: 1 free scan trial provided upon installation before the paywall triggers. Subscriptions ($10/wk, $20/mo, or $40/yr) billed securely through Apple App Store and Google Play with 1-tap cancellation anytime.
Instant AI Chart Analysis In Your Pocket
FXCharts is live on the Apple App Store and Google Play Store. Snap any chart screenshot, run institutional vision pattern segmentation, and extract precise key levels on the go.
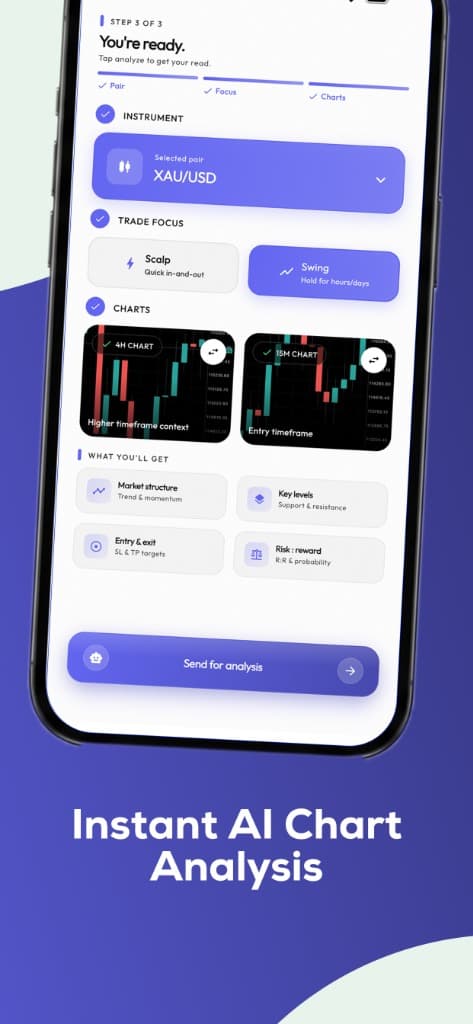
Multi-Timeframe Vision Reading
Analyze higher timeframe context (4H) alongside entry timeframes (15M) simultaneously. FXCharts correlates multi-scale market geometry in a single tap without manual drawing.
Extracts trend direction, higher highs, and momentum shifts.
Identifies dynamic support & resistance boundaries automatically.
Calculates objective SL & TP zones based on structural swings.
Validates trade probability before you execute on your broker.
Platform & Regulatory Disclosure
Statutory Notice for Cloud Reviewers, Auditors & Users:FXCharts is strictly an educational computer vision software tool. FXCharts is not a cryptocurrency exchange, broker, custodian, or financial advisor. The platform does not facilitate crypto transactions, issue tokens, or execute trades. All outputs represent automated visual pattern identification.
No Cryptocurrency Custody or Tokens
Zero wallet creation, no smart contracts, no token issuance, and no blockchain transaction routing.
No Financial Execution or Brokerage
No FIX protocol bridges, MT5 broker logins, or order book connections. 100% read-only image processing.
Pure Computer Vision (CV) Workload
High-compute GPU infrastructure strictly processes pixel matrices via PyTorch, TensorRT, and Swin Transformer backbones.
Automated Educational Markups
All trendline vectors, fair value gaps, and support/resistance zones are objective geometric annotations for research.